Considering all the buzz about big data in Human Resources, we haven’t seen much progress. The commonly cited reason is a lack of skills, but we think it is a lack of understanding and fear of the unknown.
One of the ways people create buzz about a topic is to create a cloud of mystery around it. It’s like you are standing at the bottom of a mountain as they stand on the top and shout about the magnificent view. You would like to climb the mountain, but there is a dense cloud around the mountain so you can’t see how to get there.
Let’s see if we can remove some of the mystery.
- Big Data is not Godzilla’s giant big brother. It’s call “big data” simply because there is a lot of it. You generate it every day with the transactions in your HRIS and talent management systems.
- Big Data Analytics is the process of taking different sets of data and putting them together in ways that reveal new ways of thinking. We can do that in many respects, many of them having nothing to do with advanced statistical analysis.
- You don’t need to hire a team of scientists to build a supercomputer to get started. You can get tangible business results by thinking about the data you have right now. One of our team members, a former data analyst, was doing rudimentary big data analytics years ago before he heard the term.
- Our former analyst was performing predictive calculations with computers 35 years ago. The difference between then and now is that instead of using “best guess” inputs we can use actual data to create the basis for our predictive models.
Yes, But…
We see many reasons why HR hasn’t embraced analytics yet. We have listed some of the objections we hear most frequently. We encourage you to let go of the “yabbuts” and take a fearless, realistic view of how to get started.
We don’t have the skills. Somewhere in your organization is an accountant, engineer, or another specialist you know as a spreadsheet wizard. That person has the skills to become your data analyst with a little study, training, and coaching.
Our data is in different systems. Every person-based business application has a unique person identifier. A lookup table with all the identifiers will bring all the data together in a database, spreadsheet, or analytics engine. Start by creating that table.
We don’t know how to do the math. Your accounting wizard or engineer does or can learn it in a day.
Our data isn’t accurate. No one has perfect data, and it doesn’t need to be perfect to point you in the right direction. You are dealing with large sets of aggregate data, and a few errors here and there won’t be significant. If you are working with an analytics consultant, they will deal with data errors.
It takes too much time. Only in the beginning. It gets much easier. Something that took you four days the first time will soon take ten minutes as you develop your methods.
It costs too much. Our former analyst completed his first big data analysis project with zero budget using existing software. You will eventually want better technology, but you can have an impact with what you have.
Start from Where You Are
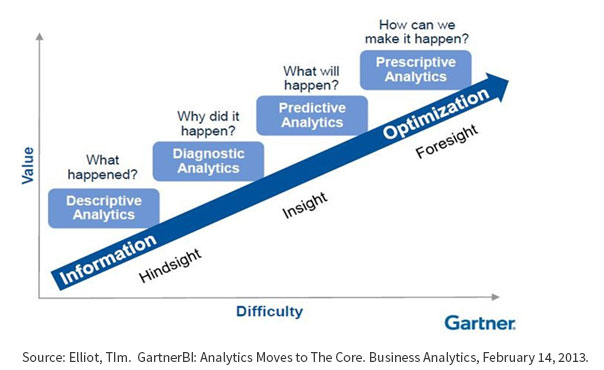
The problem, as we see it, is that the ongoing discussion is from the wrong perspective. Nearly everything we see and hear is about the view from the top of the mountain. Stop and take a realistic view of where you are today using the Gartner Analytics Maturity Model.

Gartner Analytics Maturity Model
At the first step of the maturity model, we have reports with basic information about what happened. We can answer questions like:
- How many did we hire?
- How many left and why?
- How much do our people cost?
At the second level, we can begin to do some diagnostic analysis to discover why things happened.
- Why do referrals produce better new hires?
- Why are top performers leaving?
- Why are accident rates increasing?
At the third level, we can do some predictions.
- What will happen if we increase our social media spend?
- Will manager training help us keep top performers?
- Will more safety training reduce accident rates?
At the top level, our systems can give us prescriptive analytics and decision support.
- What type of assessments should we use to improve quality of hire?
- Will a tuition reimbursement program increase revenue?
- Which training delivery methods will produce the lowest accident rates?
 You Are in the Right Place
Don’t fret If you are standing on the bottom step. You are right where you need to be, and help is on the way. There are two reasons why you can be confident about taking on analytics:
- You can derive information that will improve the profitability of your organization with the tools you have right now.
- There is help on the way. Affordable data analytics tools are coming available right now to help you gradually grow into better analytical prowess.
Solution for Beginners
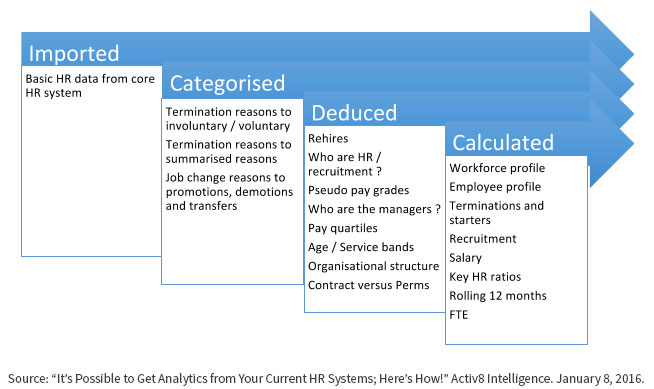
Matthew Lymbery and John Cusack of analytics firm Activ8 Intelligence, provide a better way to think about the data you already have. They present four types of data you can get from your systems right now (Figure 2).
Basic data requires no further manipulation.
Categorized data is derived by taking a large number of categories and simplifying them.
Deduced data is created by using a related data point. For example, employees who use remote connections for an extended time are mostly likely telecommuters.
Calculated data derives from two or more data points. A common example is compa-ratio.

The Payoff
Tangible results happen when you start asking the right questions. Try this example from Lymbery and Cusack:
Which managers are good at hiring good people?
A few steps will give you a metrics your CEO will love:
- Give the metric a name: Good Hire Rate.
- State the rationale for asking the question. In this case, you are focusing on quality of hire.
- Define the benchmark. It is a high performer who stays and shows up (performance rating, termination, absence)
- Create the data set:
- Employee ID (include organization and job and profile data for segmentation)
- Termination Reason
- Hiring Manager
- Length of Service (Termination Date-Start Date)
- Attendance Ratio ((Scheduled Hours-Absence Hours)/Scheduled Hours)
- Set lower limits for each result value. (example: no termination, 98% attendance ratio, 4.5 performance rating)
- Filter the data.
The result will be information you can use to take action to reduce the ratio of bad hires. Before you do, you might want to consider that the problem might not be the candidates. See our blog article on quality of hire for more information.
Recommendation
Start your analytics journey with a small success. Think about what keeps your CEO up at night. Frame it in terms of a question, and then dig into your data to see what information you put together to give you some insight into solutions. Your success will give you the leverage to ask for the resources to take the next big step.
References
Phenomecloud is a full-service technology company dedicated to helping clients solve business problems, improve the capability of their people, and achieve better results.


Leave a Comment